在本篇文章中,我们使用四种方法来实现线性回归模型,然后在使用tensoflow实现一个二次函数拟合模型。
线性回归模型
线性回归要解决的问题就是根据给出的数据学习出一个线性模型。
线性回归模型:
$$
\begin{align}
&h(x) = WX+b \quad \quad w:权重,b:偏置 \ &其中: \quad \quad X = \begin{bmatrix} x_0 \ x_1 \ .. \ x_n \end{bmatrix} \quad \quad W = \left[ \begin{matrix} w_0 \ w_1 \ .. \ w_n \end{matrix} \right] \ &损失函数 : J(\theta) = \frac{1}{2}\sum_{i=1}^{m}(h_{\theta}(x^i) - y^i)^2\quad m:样本数目 ,\theta:参数\ &我们的目的是求出使J(\theta)最小的参数\theta的值,求最小值,对每个参数\theta_j,\&求出梯度并使梯度等于0,此时J(\theta)最小
\end{align}
$$
梯度下降法
思想:沿着梯度最大的方向,迭代计算参数
迭代函数:
$$
\theta_j := \theta_j - \alpha \frac{\partial}{\partial \theta_j}J(\theta)。
$$
$$
\begin{align}
&w和b的求导结果为:\
&\frac {\partial}{\partial w_j}J(\theta) = \frac{\partial}{\partial w_j}\frac{1}{2} (h_{\theta}(x) - y)^2\
&\quad \quad \quad \quad = 2 * \frac{1}{2} (h_{\theta}(x) - y)^2\frac{\partial}{\partial w_j}(h_{\theta} - y)\
&\quad \quad \quad \quad = (h_{\theta}(x) - y) *x\
&\frac {\partial}{\partial b_j}J(\theta) = \frac{\partial}{\partial b_j}\frac{1}{2} (h_{\theta}(x) - y)^2\
&\quad \quad \quad \quad = 2 * \frac{1}{2} (h_{\theta}(x) - y)^2\frac{\partial}{\partial b_j}(h_{\theta} - y)\
&\quad \quad \quad \quad = (h_{\theta}(x) - y) \
\end{align}
$$
最小二乘法
何为最小二乘法,其实很简单。我们有很多的给定点,这时候我们需要找出一条线去拟合它,那么我先假设这个线的方程,然后把数据点代入假设的方程得到观测值,求使得实际值与观测值相减的平方和最小的参数。对变量求偏导联立便可求。
从矩阵乘和矩阵求导的方面来考虑解决问题。
$$
\begin{align}
&矩阵形式损失函数: J(\theta) = \frac{1}{2}(XW - Y)^T(XW - Y) \
&\quad \quad \quad \quad \quad \quad \quad \quad \quad \quad =\frac{1}{2}[W^TX^TXW-W^TX^TY - Y^TXW+Y^TY]\
&\quad \quad \quad \quad \quad \quad \quad \quad \quad \quad =\frac{1}{2}[W^TX^TXW-2W^TX^TY+Y^TY]\
&计算导数:\frac{\partial J(\theta)}{W} = \frac{1}{2}\frac{\partial}{W}[W^TX^TXW-2X^TY]=0\
&所以:X^TW-X^TY=0 \Rightarrow W=(X^TX)^{-1}X^TY.
\end{align}
$$
线性回归0
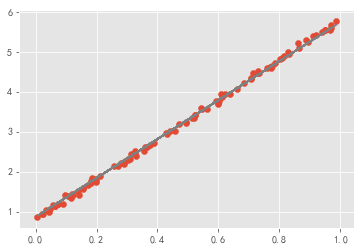
第一种实现线性回归的方法,只使用numpy来实现,根据损失函数,手动计算梯度。
 1
 2
 3
 4
 5
 6
 7
 8
 9
10
11
12
13
14
15
16
17
18
19
20
21
22
23
24
25
26
27
28
29
30
|
# 使用numpy实现线性回归
import numpy as np
import matplotlib.pyplot as plt
# style设置
from matplotlib import style
style.use('ggplot')
np.random.seed(42)
%matplotlib inline

w,b = 0,0
# 生成数据
x_data = np.random.rand(100).astype(np.float32)
noise = np.random.normal(0,0.05,x_data.shape)
y_data = 5 * x_data + 0.8 + noise
num_epoch = 500
lr = 1e-3

# 梯度下降计算w,和b
for e in range(num_epoch):
    y_pred = w * x_data + b
    # 手动计算梯度,根据mse公式
    grad_w,grad_b = (y_pred - y_data).dot(x_data),(y_pred - y_data).sum()
    w -= lr * grad_w
    b -= lr * grad_b
    if e % 50 == 0:
        print(e,w,b)

# 画图可视化
plt.scatter(x_data,y_data)
plt.plot(x_data,w * x_data + b,color = "gray")
|

线性回归1
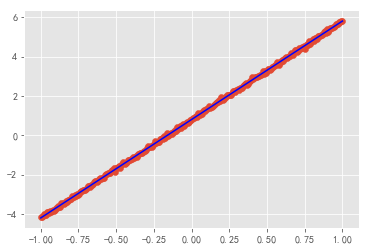
第二种实现线性回归的方法,只使用tensorflow的基本量来实现,根据损失函数,手动的计算梯度。
 1
 2
 3
 4
 5
 6
 7
 8
 9
10
11
12
13
14
15
16
17
18
19
20
21
22
23
24
25
26
27
28
29
30
31
32
33
34
35
36
37
38
39
40
41
42
43
44
45
46
47
48
49
50
51
52
53
54
55
56
57
58
59
60
61
62
63
64
65
66
67
68
69
70
71
72
73
74
75
76
|
# tensorflow 实现线性回归模型

import tensorflow as tf
import numpy as np
np.random.seed(42)
import matplotlib.pyplot as plt
# style设置
from matplotlib import style
style.use('ggplot')
%matplotlib inline

# 定义数据流,计算图
# 定义学习率的占位符
lr_ = tf.placeholder(tf.float32)
# 定义x,y的占位符
xs=tf.placeholder(tf.float32,[None,1])
ys=tf.placeholder(tf.float32,[None,1])
# 使用变量作用域的方法来设置权重和偏置
with tf.variable_scope("variable",reuse=tf.AUTO_REUSE):
    a = tf.get_variable("a",dtype=tf.float32,shape = [],initializer=tf.zeros_initializer)
    b = tf.get_variable('b',dtype=tf.float32,shape = [],initializer=tf.zeros_initializer)

# 计算预测值
y_pred = a * xs + b
# 计算损失,使用mse
loss = tf.constant(0.5) * tf.reduce_sum(tf.square(y_pred - ys))

# 反向传播,手动计算模型的梯度,根据mse公式计算得到
grad_a = tf.reduce_sum((y_pred - ys) * xs)
grad_b = tf.reduce_sum((y_pred - ys))

## 梯度下降法,手动更新参数
new_a = a - lr_ * grad_a
new_b = b - lr_ * grad_b
update_a = tf.assign(a,new_a)
update_b = tf.assign(b,new_b)

# 需要运算的节点
train = [update_a,update_b]
train_op = [a,b]
# 数据流图定义到此结束
# 直到现在为止,一直都是在定义数据图

# 定义真实的数据
num_epoch = 500
lr = 1e-3
# 生成数据
x = np.linspace(-1.0,1.0,300,dtype=np.float32)[:,np.newaxis]
noise = np.random.normal(0,0.05,x.shape)
# 假设w是5,b是0.8,然后添加噪声
y = 5 * x + 0.8 + noise
with tf.Session() as sess:
    # 初始化变量a和b
    # tf.global_variables_initializer().run()
    sess.run(tf.global_variables_initializer())
    # 循环num_epoch次,迭代更新计算
    for e in range(num_epoch):
        sess.run(train,feed_dict={xs:x,ys:y,lr_:lr})
        w,b_ = sess.run(train_op)
        if e % 50 == 0:
            print(e,w,b_)

"""
0 0.5038601 0.23991679
50 4.98277 0.7997225
100 5.005011 0.7997225
150 5.00512 0.7997225
200 5.00512 0.7997225
250 5.00512 0.7997225
300 5.00512 0.7997225
350 5.00512 0.7997225
400 5.00512 0.7997225
450 5.00512 0.7997225
"""
plt.scatter(x,y)
plt.plot(x,w * x + b_,c='blue')
|

线性回归2
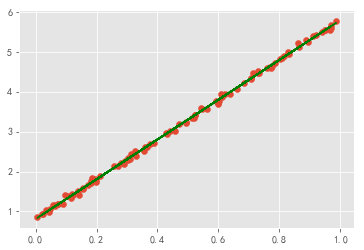
第三种实现线性回归的方法,使用tensorflow提供的优化器来计算自动计算梯度。
 1
 2
 3
 4
 5
 6
 7
 8
 9
10
11
12
13
14
15
16
17
18
19
20
21
22
23
24
25
26
27
28
29
30
31
32
33
34
35
36
37
38
39
40
41
42
43
44
45
46
47
48
49
50
51
52
53
54
55
56
57
|
import tensorflow as tf
import numpy as np
import matplotlib.pyplot as plt
# style设置
from matplotlib import style
style.use('ggplot')
np.random.seed(42)
%matplotlib inline

# 生成数据
x_data = np.random.rand(100).astype(np.float32)
noise = np.random.normal(0,0.05,x_data.shape)
y_data = 5 * x_data + 0.8 + noise

# 创建w和b
Weights = tf.Variable(tf.random_uniform([1],-1,1))  # 创建一个一维w,范围是[-1,1]
biase = tf.Variable(tf.zeros([1]))
y = Weights * x_data + biase

# 定义真实数据
num_epoch = 500
lr = 0.5
# mse的方法计算loss
loss = tf.reduce_mean(tf.square(y - y_data))
# 梯度下降优化器
optimizer = tf.train.GradientDescentOptimizer(lr)
train = optimizer.minimize(loss)
# 需要计算的权值和偏重
train_op = [Weights,biase]

#初始化变量
init = tf.global_variables_initializer()

with tf.Session() as sess:
    sess.run(init)
    for step in range(num_epoch):
        # 运行优化器
        sess.run(train)
        if step % 50 == 0:
            w,b = sess.run(train_op)
            print(step,w,b)

"""
0 [1.5435352] [3.4052124]
50 [4.8807707] [0.859452]
100 [4.9745603] [0.81199497]
150 [4.976949] [0.8107863]
200 [4.977009] [0.810756]
250 [4.977009] [0.810756]
300 [4.977009] [0.810756]
350 [4.977009] [0.810756]
400 [4.977009] [0.810756]
450 [4.977009] [0.810756]
"""

plt.scatter(x_data,y_data)
plt.plot(x_data,w * x_data + b,color = "green")
|

线性回归3
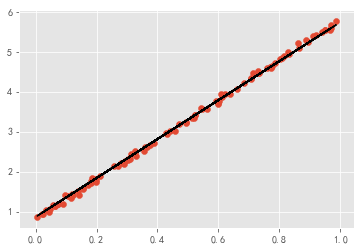
第三种实现线性回归的方法,使用tensoflow Eager Execution模式来实现。
 1
 2
 3
 4
 5
 6
 7
 8
 9
10
11
12
13
14
15
16
17
18
19
20
21
22
23
24
25
26
27
28
29
30
31
32
33
34
35
36
37
38
39
40
41
42
43
44
45
46
47
48
49
50
51
52
53
54
55
56
57
58
|
import tensorflow as tf
import numpy as np
import matplotlib.pyplot as plt
# style设置
from matplotlib import style
style.use('ggplot')
np.random.seed(42)
%matplotlib inline

# 声明使用Eager Execution模式
tf.enable_eager_execution()


# 定义变量
with tf.variable_scope("eager"):
    w = tf.get_variable('w',dtype=tf.float32,shape=[],initializer=tf.zeros_initializer)
    b = tf.get_variable('b',dtype=tf.float32,shape=[],initializer=tf.zeros_initializer)
    variables = [w,b]


# 生成数据
x_data = np.random.rand(100).astype(np.float32)
noise = np.random.normal(0,0.05,x_data.shape)
y_data = 5 * x_data + 0.8 + noise
num_epoch = 500
lr = 1e-3
# 定义优化器
optimizer = tf.train.GradientDescentOptimizer(lr)

# 迭代计算
for e in range(num_epoch):
    # 开启自动求导机制来计算导数
    with tf.GradientTape() as tape:
        # 预测值
        y_pred = w * x_data + b
        # 损失结果
        loss = 0.5 * tf.reduce_sum(tf.square(y_pred - y_data))
        if e % 50 == 0:
            print(e,w.numpy(),b.numpy())
    # 自动计算变量的梯度
    grads = tape.gradient(loss,variables)
    # 优化器根据梯度自动更新参数
    optimizer.apply_gradients(grads_and_vars=zip(grads,variables))

"""
0 0.0 0.0
50 2.4261763 2.096965
100 3.1899536 1.714988
150 3.7241528 1.4446927
200 4.098665 1.2551923
250 4.3612247 1.1223388
300 4.5453 1.0291982
350 4.6743484 0.9639001
400 4.7648215 0.9181214
450 4.8282514 0.8860268
"""
plt.scatter(x_data,y_data)
plt.plot(x_data,w.numpy() * x_data + b.numpy(),color = "black")
|

tensorflow拟合二次函数
 1
 2
 3
 4
 5
 6
 7
 8
 9
10
11
12
13
14
15
16
17
18
19
20
21
22
23
24
25
26
27
28
29
30
31
32
33
34
35
36
37
38
39
40
41
42
43
44
45
46
47
48
49
50
51
52
53
54
55
56
57
58
59
60
61
62
63
64
65
66
67
68
69
70
71
72
73
74
75
76
77
78
79
80
81
82
83
|
import tensorflow as tf
import numpy as np
import matplotlib.pyplot as plt
# style设置
from matplotlib import style
from IPython import display
style.use('ggplot')
np.random.seed(42)
%matplotlib inline

# 手动全连接层==tf.layers.dense
def add_layer(inputs,in_size,out_size,activation_function=None):
    #Weights是一个矩阵,[行,列]为[in_size,out_size]
    Weights=tf.Variable(tf.random_normal([in_size,out_size]))#正态分布
    #初始值推荐不为0,所以加上0.1,一行,out_size列
    biases=tf.Variable(tf.zeros([1,out_size])+0.1)
    #Weights*x+b的初始化的值,也就是未激活的值
    Wx_plus_b=tf.matmul(inputs,Weights)+biases # matmul 矩阵乘法
    #激活
    if activation_function is None:
        #激活函数为None,也就是线性函数
        outputs=Wx_plus_b
    else:
        outputs = activation_function(Wx_plus_b)
    return outputs

"""定义数据形式"""
# (-1,1)之间,有300个单位,后面的是维度,x_data是有300行(300个例子)
x_data=np.linspace(-1,1,300)[:,np.newaxis]
# 加噪声,均值为0,方差为0.05,大小和x_data一样
noise=np.random.normal(0,0.05,x_data.shape)
# 定义二次函数
y_data=np.square(x_data) - 0.5 + noise

# 定义占位符
xs=tf.placeholder(tf.float32,[None,1])
ys=tf.placeholder(tf.float32,[None,1])

"""建立网络"""
#定义隐藏层,输入1个节点,输出10个节点
l1 = add_layer(xs,1,10,activation_function=tf.nn.relu)
#定义输出层
out = add_layer(l1,10,1,activation_function=None)
# 以上的两句等同于下面这两句
# logits = tf.layers.dense(xs,10,activation=tf.nn.relu)
# out = tf.layers.dense(logits,1)

"""预测"""
#损失函数,算出的是每个例子的平方,要求和(reduction_indices=[1],按行求和),再求均值
loss=tf.reduce_mean(tf.reduce_sum(tf.square(ys-out),reduction_indices=[1]))

"""训练"""
#优化算法,minimize(loss)以0.1的学习率对loss进行减小
train_step=tf.train.GradientDescentOptimizer(0.1).minimize(loss)

init=tf.global_variables_initializer()
num_epoch = 500
lr = 1e-3

fig = plt.figure()
ax = fig.add_subplot(111)
ax.scatter(x_data,y_data)
# 抑制plt.show()的暂停
plt.ion()
plt.show()
with tf.Session() as sess:
    sess.run(init)
    for i in range(num_epoch):
        sess.run(train_step,feed_dict={xs:x_data,ys:y_data})
        if i%50 == 0:
            # print(i,sess.run(loss,feed_dict={xs:x_data,ys:y_data}))
            try:
                # 抹除图里面的第一条直线,也就是每次画图之前,先删除之前的
                # 由于初始lines不存在,所以会有异常
                ax.lines.remove(lines[0])
            except Exception:
                pass
            # 获取预测值
            out_val = sess.run(out,feed_dict={xs:x_data})
            # 画出拟合直线
            lines = ax.plot(x_data,out_val,"b-",lw=5)
            # 暂停0.1s
            plt.pause(0.1)
|


