Titanic是kaggle上的一道just for fun的题,没有奖金,但是数据整洁,适合用来练手,进行数据分析和机器学习。
这道题给的数据是泰坦尼克号上的乘客的信息,预测乘客是否幸存。这是个二元分类的机器学习问题,但是由于数据样本相对较少,还是具有一定的挑战性。
导入相关的库
 1
 2
 3
 4
 5
 6
 7
 8
 9
10
11
12
13
14
15
16
17
18
19
20
21
22
23
|
import numpy as np
import pandas as pd
from sklearn.preprocessing import StandardScaler
from sklearn.linear_model import LogisticRegression
from sklearn.model_selection import train_test_split
from sklearn.model_selection import KFold
from sklearn.metrics import make_scorer, confusion_matrix
from sklearn.model_selection import learning_curve
import matplotlib.pyplot as plt
import seaborn as sns

from sklearn.linear_model import LogisticRegression
from sklearn.ensemble import RandomForestClassifier, AdaBoostClassifier, GradientBoostingClassifier
from sklearn.neighbors import KNeighborsClassifier
from sklearn.naive_bayes import GaussianNB
from sklearn.neural_network import MLPClassifier
from sklearn.tree import DecisionTreeClassifier
from sklearn.svm import SVC, LinearSVC
from sklearn.metrics import accuracy_score,  roc_curve, auc

from scipy import interp

sns.set_style('whitegrid')
|
读入数据
1
2
|
trainDF = pd.read_csv('./Tantic_Data/train.csv')
testDF = pd.read_csv('./Tantic_Data/test.csv')
|
数据的一般信息
首先让我们查看一下数据的分布
Training Data
 1
 2
 3
 4
 5
 6
 7
 8
 9
10
11
12
13
14
15
16
17
|
<class 'pandas.core.frame.DataFrame'>
RangeIndex: 891 entries, 0 to 890
Data columns (total 12 columns):
PassengerId    891 non-null int64
Survived       891 non-null int64
Pclass         891 non-null int64
Name           891 non-null object
Sex            891 non-null object
Age            714 non-null float64
SibSp          891 non-null int64
Parch          891 non-null int64
Ticket         891 non-null object
Fare           891 non-null float64
Cabin          204 non-null object
Embarked       889 non-null object
dtypes: float64(2), int64(5), object(5)
memory usage: 83.6+ KB
|
Testing Data
 1
 2
 3
 4
 5
 6
 7
 8
 9
10
11
12
13
14
15
16
|
<class 'pandas.core.frame.DataFrame'>
RangeIndex: 418 entries, 0 to 417
Data columns (total 11 columns):
PassengerId    418 non-null int64
Pclass         418 non-null int64
Name           418 non-null object
Sex            418 non-null object
Age            332 non-null float64
SibSp          418 non-null int64
Parch          418 non-null int64
Ticket         418 non-null object
Fare           417 non-null float64
Cabin          91 non-null object
Embarked       418 non-null object
dtypes: float64(2), int64(4), object(5)
memory usage: 36.0+ KB
|
在上面,来自训练集的survived 列是taret / dependent / response变量。 得分为1表示乘客幸存,得分为0表示乘客死亡。
还有描述每位乘客的各种features (variables):
- PassengerID:在船上分配给旅行者的ID
- Pclass:乘客的等级,1,2或3
- Name:乘客姓名
- Sex:乘客的性别
- Age:乘客的年龄
- SibSp:与乘客一起旅行的兄弟姐妹/配偶的数量
- Parch:与乘客一起旅行的父母/子女的数量
- Ticket:乘客的机票号码
- Fare:乘客的票价
- Cabin:乘客的客舱号码
- Embarked:登船港口,S,C或Q(C = Cherbourg,Q = Queenstown,S = Southhampton)
数据探索
首先,让我们看看幸存下来的人数.
1
|
sns.countplot(x='Survived',data=trainDF)
|

大多数人都没有活下来。
让我们通过观察按性别存活的人数来进一步研究这个问题。
1
|
sns.countplot(x='Survived', hue='Sex', data=trainDF)
|

在这里我们可以看到,男性死亡的人数多于女性,而且大多数女性幸免于难。
现在让我们按Pclass看看生存计数。
1
|
sns.countplot(x='Survived',hue='Pclass', data=trainDF)
|

在这里我们可以看到,第一类的大多数幸存下来,而第三类的大多数人都死了。
让我们来看看fare分配。
1
|
plt.hist(x='Fare',data=trainDF,bins=40)
|

在这里,我们可以看到大多数人支付的费用低于50,但有一些异常值就像500美元范围内的人一样。 这可以通过每个班级中人数的差异来解释。 最低级别,3,人数最多,最高级别最少。 最低级别支付最低票价,因此此类别中有更多人。
最后,让我们使用热图查看缺失数据的数量。
1
2
|
fig, ax = plt.subplots(figsize=(12,8))
sns.heatmap(trainDF.isnull(), cmap='coolwarm', yticklabels=False, cbar=False, ax=ax)
|

让我们用test做同样的事情。
1
2
|
fig, ax = plt.subplots(figsize=(12,5))
sns.heatmap(testDF.isnull(), cmap='coolwarm', yticklabels=False, cbar=False, ax=ax)
|

数据清洗
现在让我们清理数据,以便它可以与scikit-learn模型一起使用。
缺失数据
Embarked Nulls
首先,让我们在数据集中处理NaN,我们首先从Embarked中的NaN开始。
让我们根据登船港口来看待生存机会。
 1
 2
 3
 4
 5
 6
 7
 8
 9
10
11
12
13
|
fig, (ax1, ax2, ax3) = plt.subplots(1,3, figsize=(15,5))

# Plot the number of occurances for each embarked location
sns.countplot(x='Embarked', data=trainDF, ax=ax1)

# Plot the number of people that survived by embarked location
sns.countplot(x='Survived', hue = 'Embarked', data=trainDF, ax=ax2, order=[1,0])

# Group by Embarked, and get the mean for survived passengers for each
# embarked location
embark_pct = trainDF[['Embarked','Survived']].groupby(['Embarked'],as_index=False).mean()
# Plot the above mean
sns.barplot(x='Embarked',y='Survived', data=embark_pct, order=['S','C','Q'], ax=ax3)
|

在这里,我们可以看到大多数人从S出发,因此大多数幸存下来的人都是S.但是,当我们查看幸存人数的平均值与登机位置登记的总人数时, S的存活率最低。
这不足以确定上述人员登上哪个港口。 让我们看看其他可能表明乘客登船的变量
没有其他用户共享相同的票号。 让我们寻找支付类似票价的同一班级的人。
1
|
trainDF[(trainDF['Pclass'] == 1) & (trainDF['Fare'] > 75) & (trainDF['Fare'] < 85)].groupby('Embarked')['PassengerId'].count()
|
1
2
3
4
|
Embarked
C    16
S    13
Name: PassengerId, dtype: int64
|
在拥有相同级别并支付相同票价的人中,有16人从C出发,13人从S出发。
现在,由于支付类似票价的同一班级的大多数人来自C,而从C开始的人拥有最高的生存率,我们认为这些人可能从C开始。我们现在将他们的登船价值改为 C。
1
2
|
# Set Value
trainDF = trainDF.set_value(trainDF['Embarked'].isnull(), 'Embarked','C')
|
1
|
/Users/apple/Soft/miniconda3/lib/python3.5/site-packages/ipykernel_launcher.py:2: FutureWarning: set_value is deprecated and will be removed in a future release. Please use .at[] or .iat[] accessors instead
|
Fare nulls
现在来处理Fare列.
让我们想象一下从南安普敦出发的三等乘客支付的票价的直方图。
1
2
3
4
5
6
7
|
fig,ax = plt.subplots(figsize=(8,5))

testDF[(testDF['Pclass'] == 3) & (testDF['Embarked'] == 'S')]['Fare'].hist(bins=100, ax=ax)

plt.xlabel('Fare')
plt.ylabel('Frequency')
plt.title('Histogram of Fare for Pclass = 3, Embarked = S'
|

1
2
3
|
print ("The top 5 most common fares:")

testDF[(testDF['Pclass'] == 3) & (testDF['Embarked'] == 'S')]['Fare'].value_counts().head()
|
1
|
The top 5 most common fares:
|
1
2
3
4
5
6
|
8.0500    17
7.8958    10
7.7750    10
8.6625     8
7.8542     8
Name: Fare, dtype: int64
|
使用众数填充Fare列的缺失值, $8.05.
1
2
3
|
# Fill value
testDF.set_value(testDF.Fare.isnull(), 'Fare', 8.05)
# Verify
|
Age nulls
现在让我们在训练和测试集中填写缺失的年龄数据。 填充的一种方法是用柱的方式填充NaN。 通过逐类查看平均年龄,我们可以使这个填充过程更加智能化。
1
2
|
plt.figure(figsize=(12,7))
sns.boxplot(x='Pclass', y='Age', data=trainDF)
|

1
|
trainDF.groupby('Pclass')['Age'].mean()
|
1
2
3
4
5
|
Pclass
1    38.233441
2    29.877630
3    25.140620
Name: Age, dtype: float64
|
我们看到等级越高,平均年龄就越高。 然后我们可以使用上述方法编写一个函数来填充NaN年龄值。
1
2
3
4
5
6
7
8
9
|
def fixNaNAge(age, pclass):
    if age == age:
        return age
    if pclass == 1:
        return 38
    elif pclass == 2:
        return 30
    else:
        return 25
|
现在,我们将在训练和测试数据框中填写年龄NaN,并验证它们是否正确填充。
1
2
|
trainDF['Age'] = trainDF.apply(lambda row: fixNaNAge(row['Age'],row['Pclass']),axis=1)
testDF['Age'] = testDF.apply(lambda row: fixNaNAge(row['Age'],row['Pclass']), axis=1
|
1
2
3
|
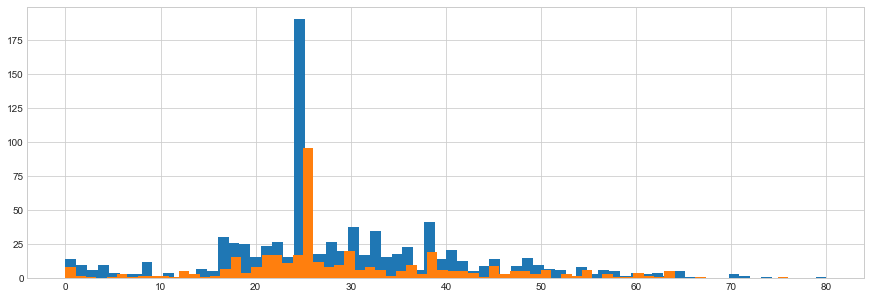
fig = plt.figure(figsize=(15,5))
trainDF['Age'].astype(int).hist(bins=70)
testDF['Age'].astype(int).hist(bins=70)
|

 1
 2
 3
 4
 5
 6
 7
 8
 9
10
|
facet = sns.FacetGrid(trainDF, hue='Survived', aspect=4)
facet.map(sns.kdeplot, 'Age', shade=True)
facet.set(xlim=(0, trainDF['Age'].max()))
facet.add_legend()

fig, ax = plt.subplots(1,1,figsize=(18,4))

age_mean = trainDF[['Age','Survived']].groupby(['Age'],as_index=False).mean()

sns.barplot(x='Age', y='Survived', data=age_mean)
|

Cabin nulls
最后,对于机舱列,我们缺少太多信息来正确填充它,因此我们可以完全放弃该特征。
1
2
|
trainDF.drop('Cabin', axis=1,inplace=True)
testDF.drop('Cabin', axis=1, inplace=True)
|
Adding features
这些名称的前缀在某些情况下表明了社会地位,这可能是事故幸存的重要因素。
- Braund, Mr. Owen Harris
- Heikkinen, Miss. Laina
- Oliva y Ocana, Dona. Fermina
- Peter, Master. Michael J
提取乘客头衔并在名为Title的附加栏中引导他们
 1
 2
 3
 4
 5
 6
 7
 8
 9
10
11
12
13
14
15
16
17
18
19
20
|
Title_Dictionary = {
    "Capt":         "Officer",
    "Col":          "Officer",
    "Major":        "Officer",
    "Jonkheer":     "Nobel",
    "Don":          "Nobel",
    "Sir" :         "Nobel",
    "Dr":           "Officer",
    "Rev":          "Officer",
    "the Countess": "Nobel",
    "Dona":         "Nobel",
    "Mme":          "Mrs",
    "Mlle":         "Miss",
    "Ms":           "Mrs",
    "Mr" :          "Mr",
    "Mrs" :         "Mrs",
    "Miss" :        "Miss",
    "Master" :      "Master",
    "Lady" :        "Nobel"
}
|
1
2
|
trainDF['Title'] = trainDF['Name'].apply(lambda x: Title_Dictionary[x.split(',')[1].split('.')[0].strip()])
testDF['Title'] = testDF['Name'].apply(lambda x: Title_Dictionary[x.split(',')[1].split('.')[0].strip()])
|
Aggregating Features
让我们添加一个字段FamilySize,它聚合字段中的信息,表明存在合作伙伴(Parch)或亲戚(Sibsp)。
1
2
|
trainDF['FamilySize'] = trainDF['SibSp'] + trainDF['Parch']
testDF['FamilySize'] = testDF['SibSp'] + testDF['Parch']
|
乘客的性别是事故幸存的重要因素。 乘客的年龄也是如此(例如,给予妇女和儿童的优惠待遇)。 让我们介绍一个新功能,以考虑到乘客的性别和年龄。
1
2
3
|
def getPerson(passenger):
    age, sex = passenger
    return 'child' if age < 16 else sex
|
1
2
|
trainDF['Person'] = trainDF[['Age', 'Sex']].apply(getPerson, axis=1)
testDF['Person'] = testDF[['Age', 'Sex']].apply(getPerson, axis=1)
|
Dropping Useless Features
现在让我们放弃那些不再感兴趣的特征,因为它们没有显示任何不可理解的特征,或者它们已经聚合到另一个特征中。
我们将要删除的特征是PassengerID, Name, Sex, Ticket, SibSp, Parch.
1
2
3
4
|
features_to_drop = ['PassengerId','Name','Sex','Ticket','SibSp','Parch']

trainDF.drop(labels=features_to_drop, axis=1, inplace=True)
testDF.drop(labels=features_to_drop, axis=1, inplace=True)
|
Convert Categorical Variables
分类变量需要转换为数值,因为scikit-learn仅将数值作为numpy数组中的输入。
我们可以使用数字表示分类值,但是这种编码意味着类别中值之间的有序关系。 为避免这种情况,我们可以使用虚拟变量对分类值进行编码。
我们拥有的四个分类特征是Pclass,Embarked,Title和Person。 在这4个中,可能没有Person,Title,Embarked的有序关系,所以我们将对这些进行热编码,同时对Pclass进行数字编码。
我们通过为每个要素类别创建一个特征来进行热编码。 如果原始要素属于该类别,则类别列的值将为1。 只有一个分类要素列可以具有1.删除一列也很常见,因为剩下的列隐含了它的值。
 1
 2
 3
 4
 5
 6
 7
 8
 9
10
11
12
13
14
15
16
17
|
# Create dummy features for each categorical feature
dummies_person_train = pd.get_dummies(trainDF['Person'], prefix='Person')
dummies_embarked_train = pd.get_dummies(trainDF['Embarked'], prefix='Embarked')
dummies_title_train = pd.get_dummies(trainDF['Title'], prefix='Title')

# Add the new features to the dataframe via concating
tempDF = pd.concat([trainDF, dummies_person_train, dummies_embarked_train, dummies_title_train], axis=1)

# Drop the original categorical feature columns
tempDF = tempDF.drop(['Person','Embarked','Title'],axis=1)

# Drop one of each of the dummy variables because its value is implied
# by the other dummy variable columns
# E.g. if Person_male = 0, and Person_female = 0, then the person
# is a child

trainDF = tempDF.drop(['Person_child','Embarked_C','Title_Master'],axis=1)
|
 1
 2
 3
 4
 5
 6
 7
 8
 9
10
11
12
13
14
15
16
17
|
# Create dummy features for each categorical feature
dummies_person_test = pd.get_dummies(testDF['Person'], prefix='Person')
dummies_embarked_test = pd.get_dummies(testDF['Embarked'], prefix='Embarked')
dummies_title_test = pd.get_dummies(testDF['Title'], prefix='Title')

# Add the new features to the dataframe via concating
tempDF = pd.concat([testDF, dummies_person_test, dummies_embarked_test, dummies_title_test], axis=1)

# Drop the original categorical feature columns
tempDF = tempDF.drop(['Person','Embarked','Title'],axis=1)

# Drop one of each of the dummy variables because its value is implied
# by the other dummy variable columns
# E.g. if Person_male = 0, and Person_female = 0, then the person
# is a child

testDF = tempDF.drop(['Person_child','Embarked_C','Title_Master'],axis=1)
|
机器学习模型
现在在本节中,我们将训练几个模型并调整它们,看看我们是否可以提高性能。
调整模型的方法不止一种。 它通常是一种非常迭代的方法。 由于它是迭代的,我们通常需要单个数字评估指标来优化并在2个不同模型之间做出决策。
通常会有一个您正在优化的度量标准,然后是对其他度量标准的约束。
一些可能用到的评价指标:
- maximizing accuracy
- minimizing error
- maximizing roc
可能包含的约束:
- model size <= 100 MB
- FPR >= 75%
- inference time < 1 second
如果一个模型满足约束条件并且在您尝试优化的度量标准中做得更好,则它比另一个模型更好。
此外,为了获得模型的广义性能,通常在训练集中进行交叉验证。
在这种情况下,我们只是最大限度地提高交叉验证的准确性。
Seperate Data
首先切分数据:
1
2
|
X = trainDF.drop(['Survived'],axis=1)
y = trainDF['Survived']
|
Let’s also create a dataframe to store our results from training:
1
2
|
resultDF = pd.DataFrame(columns=['model','hyperparams','train_acc','train_std','test_acc','test_std'])
df_idx = 0
|
Baseline Models
为了开始这个,我们将训练一些基线模型(具有默认值的模型)以获得要击败的基线。
首先,我们将创建一个模型字典,以便我们可以循环并迭代地构建和评估它们。
1
2
3
4
5
6
7
|
models = {
    'knn': KNeighborsClassifier(),
    'log': LogisticRegression(solver='lbfgs'),
    'dt': DecisionTreeClassifier(),
    'rf': RandomForestClassifier(),
    'ab': AdaBoostClassifier()
}
|
现在让我们编写一个函数来运行给定模型和数据集的交叉验证。
 1
 2
 3
 4
 5
 6
 7
 8
 9
10
11
12
13
14
15
16
17
18
19
20
21
22
23
24
25
26
27
28
29
30
31
32
33
34
35
36
37
38
39
40
41
42
43
44
45
46
47
48
49
50
51
52
53
54
55
56
57
58
59
|
def crossValidate(typ, model, X, y, hyperparams='default', verbose=0):
    global df_idx

    # Update model hyperparameters if given
    if hyperparams is not 'default':
        model.set_params(**hyperparams)

    # Initialize scaler class
    scaler = StandardScaler()

    # Get kFolds
    kfold = KFold(n_splits=10)
    kfold.get_n_splits(X)

    # Initialize storage vectors
    trainACC = np.zeros(10)
    testACC = np.zeros(10)
    np_idx = 0

    # Loop through folds
    for train_idx, test_idx in kfold.split(X):
        X_train, X_test = X.values[train_idx], X.values[test_idx]
        y_train, y_test = y.values[train_idx], y.values[test_idx]

        # Scale data
        X_train = scaler.fit_transform(X_train)
        X_test = scaler.transform(X_test)

        # Fit to training set
        model.fit(X_train, y_train)

        # Make predictions on testing set
        y_train_pred = model.predict(X_train)
        y_test_pred = model.predict(X_test)

        # Compute training and testing accuracy
        trainACC[np_idx] = accuracy_score(y_train, y_train_pred)*100
        testACC[np_idx] = accuracy_score(y_test, y_test_pred)*100
        np_idx += 1

        # Print fold accuracy if verbose level 2
        if verbose == 2:
            print ("    Fold {}: Accuracy: {}%".format(np_idx, round(testACC[-1],3)))

    # Print average accuracy if verbose level 1
    if verbose == 1:
        print ("  Average Score: {}%({}%)".format(round(np.mean(testACC),3),round(np.std(testACC),3)))

    # Update dataframe
    resultDF.loc[df_idx, 'model'] = typ
    resultDF.loc[df_idx, 'hyperparams'] = str(hyperparams)
    resultDF.loc[df_idx, 'train_acc'] = trainACC.mean()
    resultDF.loc[df_idx, 'train_std'] = trainACC.std()
    resultDF.loc[df_idx, 'test_acc'] = testACC.mean()
    resultDF.loc[df_idx, 'test_std'] = testACC.std()
    df_idx += 1

    # Return average testing accuracy, and fitted model
    return testACC.mean(), model
|
现在我们可以使用上面的函数循环并交叉验证每个模型。
1
2
3
|
for name, m in models.items():
    print ("Fitting " + name + " model")
    _, models[name] = crossValidate(name, m, X, y, 'default', 1)
|
 1
 2
 3
 4
 5
 6
 7
 8
 9
10
|
Fitting dt model
  Average Score: 79.357%(4.778%)
Fitting rf model
  Average Score: 80.923%(4.192%)
Fitting ab model
  Average Score: 80.7%(3.331%)
Fitting knn model
  Average Score: 80.7%(3.136%)
Fitting log model
  Average Score: 82.27%(3.495%)
|
我们还可以查看我们为存储值而创建的数据框中的所有结果。
|
hyperparams |
train_acc |
train_std |
test_acc |
test_std |
| model |
|
|
|
|
|
| log |
default |
83.002902 |
0.355647 |
82.269663 |
3.495014 |
| rf |
default |
96.919733 |
0.511827 |
80.922597 |
4.192015 |
| ab |
default |
84.249987 |
0.716843 |
80.700375 |
3.330767 |
| knn |
default |
86.619375 |
0.436454 |
80.700375 |
3.135529 |
| dt |
default |
98.428741 |
0.138747 |
79.357054 |
4.777630 |
Plot ROC curve for baseline models
我们现在可以使用以下函数绘制我们构建的每个模型的roc曲线。
 1
 2
 3
 4
 5
 6
 7
 8
 9
10
11
12
13
14
15
16
17
18
19
20
21
22
23
24
25
26
27
28
29
30
31
32
33
34
35
36
37
38
39
40
41
42
43
44
45
46
47
48
49
50
51
52
53
54
55
56
57
58
59
60
61
62
63
64
65
66
67
68
69
70
71
72
73
74
75
76
|
def plot_roc_curve(name, model, X, y):
    # Initialize scaler
    scaler = StandardScaler()

    # Get kfolds
    kfold = KFold(n_splits=10)
    kfold.get_n_splits(X)

    # Initalize storage lists
    tprs = []
    aucs = []
    mean_fpr = np.linspace(0, 1, 100)

    i = 0
    # Loop through folds
    for train_idx, test_idx in kfold.split(X):
        # Split data
        X_train, X_test = X.values[train_idx], X.values[test_idx]
        y_train, y_test = y.values[train_idx], y.values[test_idx]

        # Scale data
        X_train = scaler.fit_transform(X_train)
        X_test = scaler.transform(X_test)

        # Fit model to fold
        model.fit(X_train, y_train)

        # Get probabilities for X_test
        y_test_proba = model.predict_proba(X_test)

        # Get FPR, TPR, and AUC vals based on probabilities
        fpr, tpr, _ = roc_curve(y_test, y_test_proba[:,1])
        roc_auc = auc(fpr, tpr)

        # Append tpr and auc
        tprs.append(interp(mean_fpr, fpr, tpr))
        tprs[-1][0] = 0.0
        aucs.append(roc_auc)

        # Plot roc for fold
        plt.plot(fpr, tpr, lw=1, alpha=0.3,
             label='ROC fold %d (AUC = %0.2f)' % (i, roc_auc))

        i += 1

    # Plot random guessing line
    plt.plot([0, 1], [0, 1], linestyle='--', lw=2, color='r',
         label='Chance', alpha=.8)

    # Get mean tpr and mean/std for auc
    mean_tpr = np.mean(tprs, axis=0)
    mean_tpr[-1] = 1.0
    mean_auc = auc(mean_fpr, mean_tpr)
    std_auc = np.std(aucs)

    # Plot mean curve
    plt.plot(mean_fpr, mean_tpr, color='b',
             label=r'Mean ROC (AUC = %0.2f $\pm$ %0.2f)' % (mean_auc, std_auc),
             lw=2, alpha=.8)

    # Fill area between plots
    std_tpr = np.std(tprs, axis=0)
    tprs_upper = np.minimum(mean_tpr + std_tpr, 1)
    tprs_lower = np.maximum(mean_tpr - std_tpr, 0)
    plt.fill_between(mean_fpr, tprs_lower, tprs_upper, color='grey', alpha=.2,
                     label=r'$\pm$ 1 std. dev.')

    # style
    plt.xlim([-0.05, 1.05])
    plt.ylim([-0.05, 1.05])
    plt.xlabel('False Positive Rate')
    plt.ylabel('True Positive Rate')
    plt.title(name + ' Receiver operating characteristic curve')
    plt.legend(loc="lower right")

    return mean_fpr, mean_tpr, mean_auc, std_auc
|
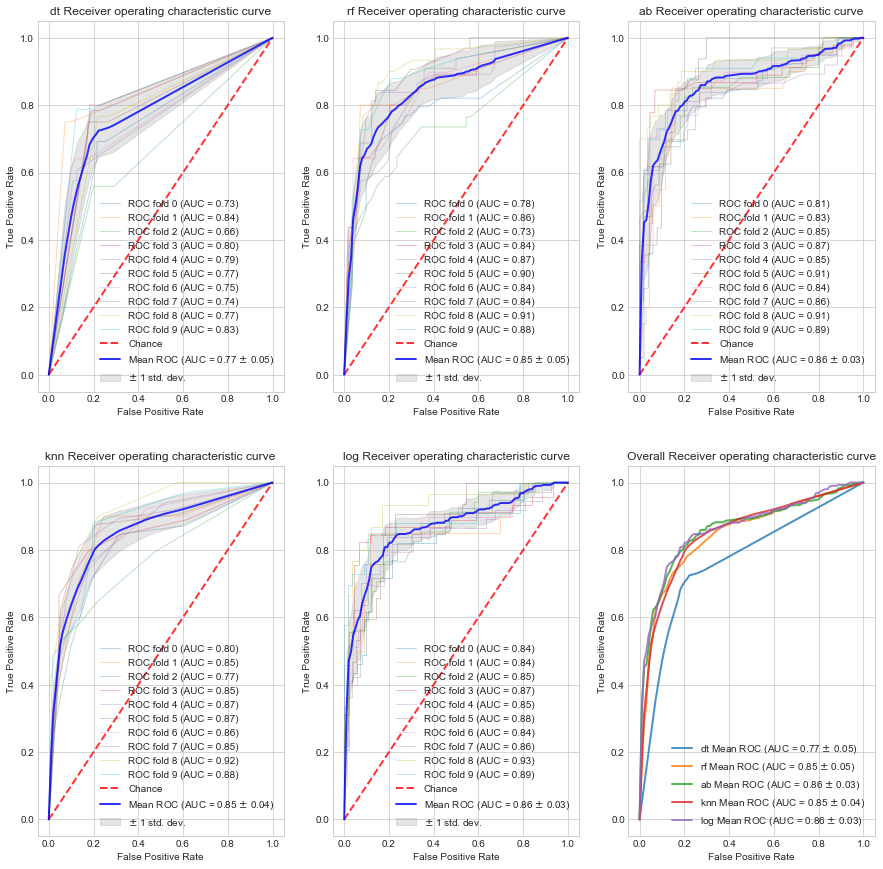
现在,对于我们创建的每个模型,我们将循环并绘制每个折叠的ROC曲线+平均ROC曲线。 我们还将在同一图上绘制所有模型的平均ROC曲线以进行比较
 1
 2
 3
 4
 5
 6
 7
 8
 9
10
11
12
13
14
15
16
17
|
plt_id = 1
plt.figure(figsize=(15,15))
for name, m in models.items():
    ax = plt.subplot(2,3,plt_id)
    fpr, tpr, auc_mean, auc_std = plot_roc_curve(name, m, X, y)
    plt_id+=1

    ax = plt.subplot(2,3,6)
    plt.plot(fpr, tpr, label=name + r' Mean ROC (AUC = %0.2f $\pm$ %0.2f)' % (auc_mean, auc_std),
             lw=2, alpha=.8)

plt.xlim([-0.05, 1.05])
plt.ylim([-0.05, 1.05])
plt.xlabel('False Positive Rate')
plt.ylabel('True Positive Rate')
plt.title('Overall Receiver operating characteristic curve')
plt.legend(loc="lower right")
|

现在我们已经构建了基线模型,我们现在可以尝试进行超参数调整,以构建一个模型,该模型在我们选择的度量标准上的开发集上做得更好(在这种情况下,使用acc进行交叉验证)。
进行超参数调整的3种常见方法是:
- Discrete Grid Search
- Randomized Grid Search
- Coarse-to-fine grid search
Discrete Grid Search
- 创建一个与超级参数的数量相对应的n空间网格,以便调整并尝试每种组合
- 可以构建最佳模型
- 可能需要很长时间才能尝试每种组合
- 超参数的重要性不相同。
Randomized Grid Search
- 随机尝试一组参数
- 有利于解决不相等的超参数
- 证明可以非常快速地获得次优结果
Coarse-to-fine grid search
- 这可以与随机/离散网格搜索结合使用
- 从粗网格开始,迭代地转到更精细的网格以缩小结果范围。
Randomized Grid Search
下面我们将展示随机网格搜索技术的一个例子。 以下技术明确编码以供参考。 这在sklearn中打包为RandomizedGridSearchCV。
首先,我们将编写一个函数来应用随机网格搜索给定模型,一组超参数和数据。
 1
 2
 3
 4
 5
 6
 7
 8
 9
10
11
12
13
14
15
16
17
18
19
20
21
22
23
24
25
26
27
28
29
30
31
|
def gridSearch(name, models, param_grids, X, y, num_trials=100, verbose=0):
    # Get model and param grid
    model = models[name]
    current_param_grid = param_grids[name]

    # Create variable to store best model
    best_model = model

    # Loop through trials
    for nTrial in range(num_trials):
        if verbose == 2 and nTrial % 10 == 0:
            print ('  Trial: %d' % (nTrial))

        # Get current best accuracy for model from the results dataframe
        best_acc = resultDF[resultDF['model'] == name]['test_acc'].max()

        # Randomly select params from grid
        params = {}
        for k, v in current_param_grid.items():
            params[k] = np.random.choice(v)

        # Cross validate model with selected hyperparams using the function we generated earlier
        acc,model = crossValidate(name, model, X, y, params, 0)

        # Update best model if it satisfies our optimizing metric
        if acc > best_acc:
            if verbose == 1:
                print ('    New best ' +  name + ' model: ' + str(acc))
            best_model = model
    # Return best model
    return best_model
|
现在让我们指定一组要循环的参数。 请记住考虑基本规模。
例如,对于学习率,更理想的是以对数标度(0.001,0.01,0.1等)与线性标度(0.001,0.002,0.003,0.004等)进行网格搜索。
 1
 2
 3
 4
 5
 6
 7
 8
 9
10
11
12
13
14
15
16
17
18
|
param_grids = {}
param_grids['knn'] = {"n_neighbors": np.arange(1,11,1)}
param_grids['log'] = {'C': [0.001,0.01,0.1,1,10,100],
                      'solver':['newton-cg','lbfgs','liblinear','sag']}
param_grids['dt'] = {'criterion': ['gini','entropy'],
                     'max_depth': np.arange(1,6,1),
                     'min_samples_split': np.arange(3,10,1),
                     'max_features': np.arange(1,6,1)
                     }
param_grids['rf'] =  {'n_estimators': [int(x) for x in np.arange(10,200,10)],
                      'max_features': ['auto','sqrt','log2'],
                      'max_depth': [int(x) for x in np.arange(1,5)] + [None],
                      'min_samples_split': [2,5,10],
                      'min_samples_leaf': [1,2,4],
                      'bootstrap': [True,False]
                      }
param_grids['ab'] = {'n_estimators': [int(x) for x in np.arange(10,200,10)],
                    'learning_rate': [0.01,0.1,1,2]}
|
现在使用以上的参数来对模型进行调优
1
2
3
|
for name in models.keys():
    print (name)
    models[name] = gridSearch(name, models, param_grids, X, y, 50, 1)
|
 1
 2
 3
 4
 5
 6
 7
 8
 9
10
11
12
13
14
15
16
17
18
19
|
dt
    New best dt model: 82.4918851436
    New best dt model: 82.7153558052
    New best dt model: 82.7166042447
    New best dt model: 82.8302122347
rf
    New best rf model: 82.4906367041
    New best rf model: 83.2784019975
    New best rf model: 83.5043695381
    New best rf model: 84.1797752809
ab
    New best ab model: 81.0349563046
    New best ab model: 82.3807740325
    New best ab model: 82.9413233458
knn
    New best knn model: 82.0486891386
    New best knn model: 82.1610486891
log
    New best log model: 82.8289637953
|
我们还可以在结果数据框中查看当前最佳结果。
|
hyperparams |
train_acc |
train_std |
test_acc |
test_std |
| model |
|
|
|
|
|
| rf |
{’n_estimators’: 90, ‘min_samples_leaf’: 2, ' |
88.0534 |
0.3362 |
84.1797 |
4.2544 |
| ab |
{’n_estimators’: 30, ’learning_rate’: 0.10. |
83.0777 |
0.4232 |
82.9413 |
4.2242 |
| dt |
{‘max_features’: 5, ‘criterion’: ’entropy’, |
84.3373 |
0.4706 |
82.8302 |
2.2328 |
| log |
{‘solver’: ‘sag’, ‘C’: 0.10000000000000001} |
83.0153 |
0.3921 |
82.8289 |
3.9226 |
| knn |
{’n_neighbors’: 8} |
85.0729 |
0.5309 |
82.1610 |
4.3016 |
Plot ROC curve for tuned models
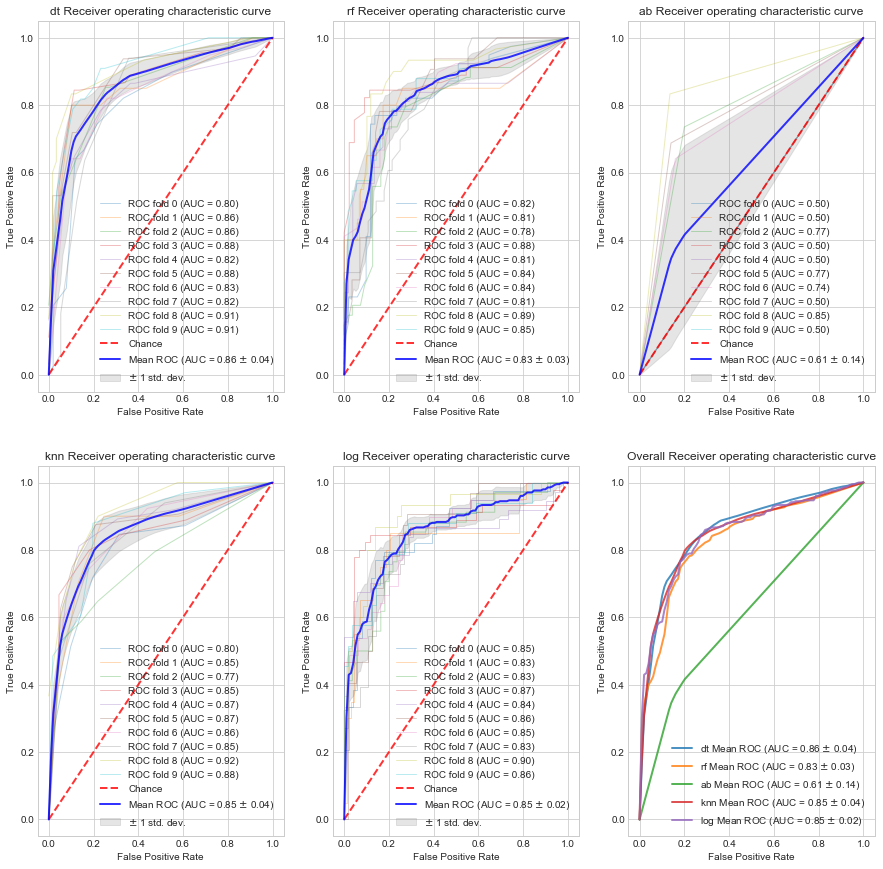
我们现在可以使用上面的函数绘制我们调整的每个模型的roc曲线。
 1
 2
 3
 4
 5
 6
 7
 8
 9
10
11
12
13
14
15
16
17
|
plt_id = 1
plt.figure(figsize=(15,15))
for name, m in models.items():
    ax = plt.subplot(2,3,plt_id)
    fpr, tpr, auc_mean, auc_std = plot_roc_curve(name, m, X, y)
    plt_id+=1

    ax = plt.subplot(2,3,6)
    plt.plot(fpr, tpr, label=name + r' Mean ROC (AUC = %0.2f $\pm$ %0.2f)' % (auc_mean, auc_std),
             lw=2, alpha=.8)

plt.xlim([-0.05, 1.05])
plt.ylim([-0.05, 1.05])
plt.xlabel('False Positive Rate')
plt.ylabel('True Positive Rate')
plt.title('Overall Receiver operating characteristic curve')
plt.legend(loc="lower right")
|

Evaluating a new model
使用上述函数,我们可以轻松地在我们的数据集上评估另一个模型。
例如,让我们在我们的数据集上评估一个神经网络。
1
2
3
|
# build baseline model
models['nn'] = MLPClassifier((32, 32), early_stopping=False)
_, models['nn'] = crossValidate('nn', models['nn'], X, y, 'default', 1)
|
1
|
Average Score: 82.045%(3.242%)
|
1
2
3
4
5
6
|
# randomized grid search to tune
param_grids['nn'] = {'alpha': [1e-4,1e-3,1e-2,1e-1],
                     'hidden_layer_sizes': [(20,10),(80,10),(10,20,20,10),
                                            (10,10,10),(64,64,64),(64,64,64,64),
                                            (16,32,64,64,32,16),(32,32,32,32,32,32)]}
models['nn'] = gridSearch('nn', models, param_grids, X, y, 50, 1)
|
1
2
3
4
|
    New best nn model: 82.1585518102
    New best nn model: 82.4918851436
    New best nn model: 82.4981273408
    New best nn model: 82.6092384519
|
经过调节超参数的结果后:
|
hyperparams |
train_acc |
train_std |
test_acc |
test_std |
| model |
|
|
|
|
|
| rf |
{’n_estimators’: 90, ‘min_samples_leaf’: 2, . |
88.0534 |
0.3362 |
84.1797 |
4.2544 |
| ab |
{’n_estimators’: 30, ’learning_rate’: 0.10.. |
83.0777 |
0.4232 |
82.9413 |
4.2242 |
| dt |
{‘max_features’: 5, ‘criterion’: ’entropy’, . |
84.3373 |
0.4706 |
82.8302 |
2.2328 |
| log |
{‘solver’: ‘sag’, ‘C’: 0.10000000000000001} |
83.0153 |
0.3921 |
82.8289 |
3.9226 |
| nn |
{‘hidden_layer_sizes’: (80, 10), ‘alpha’: … |
83.0029 |
0.7526 |
82.6092 |
3.7357 |
| knn |
{’n_neighbors’: 8} |
85.0729 |
0.5309 |
82.1610 |
4.3016 |
 1
 2
 3
 4
 5
 6
 7
 8
 9
10
11
12
13
14
15
16
17
18
|
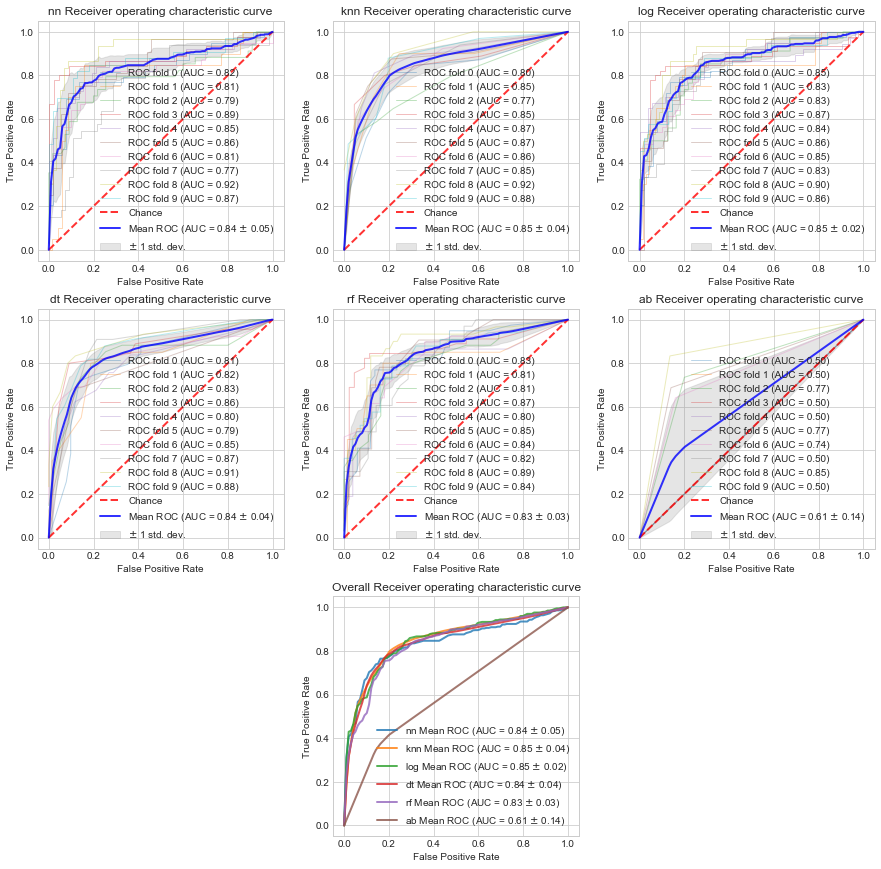
# View updated roc curves
plt_id = 1
plt.figure(figsize=(15,15))
for name, m in models.items():
    ax = plt.subplot(3,3,plt_id)
    fpr, tpr, auc_mean, auc_std = plot_roc_curve(name, m, X, y)
    plt_id+=1

    ax = plt.subplot(3,3,8)
    plt.plot(fpr, tpr, label=name + r' Mean ROC (AUC = %0.2f $\pm$ %0.2f)' % (auc_mean, auc_std),
             lw=2, alpha=.8)

plt.xlim([-0.05, 1.05])
plt.ylim([-0.05, 1.05])
plt.xlabel('False Positive Rate')
plt.ylabel('True Positive Rate')
plt.title('Overall Receiver operating characteristic curve')
plt.legend(loc="lower right")
|


